

A post adapted from Markus Stocker’s website: http://markusstocker.com/data-analysis-on-interoperable-infrastructure/
This post is an executive summary of Section 2.6 of ENVRIplus deliverable D9.2, which will be published soon. The section presents a demonstrator recently developed in the context of the project. It demonstrates how data analysis can be exposed to researchers as a Web-based service while interoperable Research Infrastructures and e-Infrastructures orchestrate everything else.
Somewhat boldly, I am suggesting that we prototype the future of scientific data analysis on interoperable Research Infrastructures and e-Infrastructures (henceforth referred to as infrastructures).
The story. Matti is a graduate student who is embarking postgraduate research in atmospheric science. One of his tasks is the analysis of data to detect and describe new particle formation events—atmospheric events whereby aerosol particles form and grow in diameter size over time. Matti is instructed by his supervisors to use a D4Science virtual research environment (VRE) for data analysis. Indeed, the research group had recently decided to move their data analysis from local computing environments (the researchers’ workstations) into a VRE. The VRE enables researchers to focus on analysing data and thereby address scientific questions while the infrastructure takes care of everything else, in particular: (1) Load data into computing environments for subsequent analysis; (2) Represent data and their semantics derived in analysis, following relevant vocabularies; (3) Systematically acquire derivative data in infrastructures and register them in catalogues.
The rationale. FAIR data is globally on the agenda of infrastructure development. We adopt the design principle not to leave making data FAIR to researchers. Instead, we suggest that infrastructures should curate FAIR data by Design. We thus weave data FAIRness into infrastructures’ fabric. A crucial factor to this effect is the removal of manual download and upload of data from and to systems.
The implementation. Matti accesses the D4Science VRE and opens a Jupyter notebookthat supports data analysis. The notebook is served by JupyterLab at EGI. The following figure displays the notebook as seen by Matti.
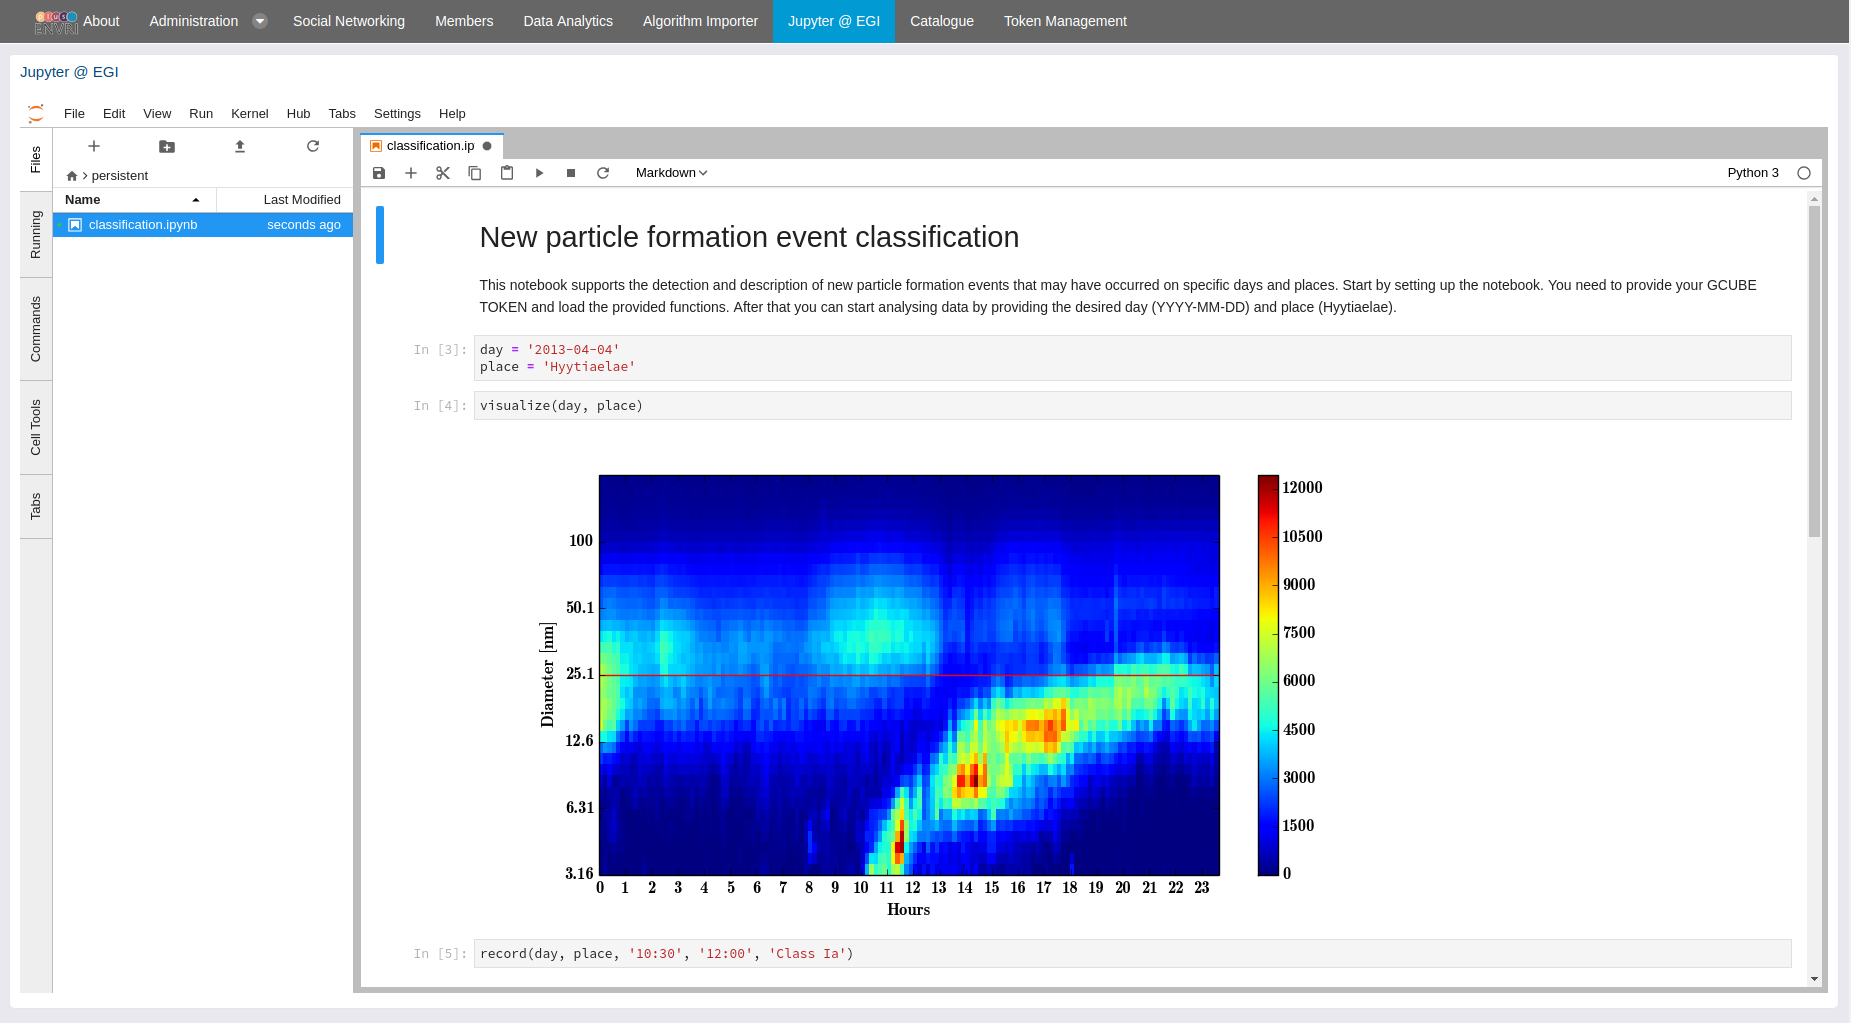
The notebook makes use of D4Science Data Miner algorithms, accessed via WPS interface. One algorithm fetches the data consumed in analysis i.e., particle size distribution data, via the SmartSMEAR API of the Finnish Station for Measuring Ecosystem-Atmosphere Relations (SMEAR) Research Infrastructure. This algorithm also plots data as shown in the figure above. The plot is used by Matti to decide whether or not an event has occurred on the given day and place, and describe the event for its attributes.
The second algorithm collects the data produced in analysis i.e., a data tuple for event attributes, and creates a machine readable description of information (i.e., data and their semantics) about the event. The algorithm also registers the acquired derivative data in the CKAN based D4Science catalog. The following figure shows cataloged derivative data.
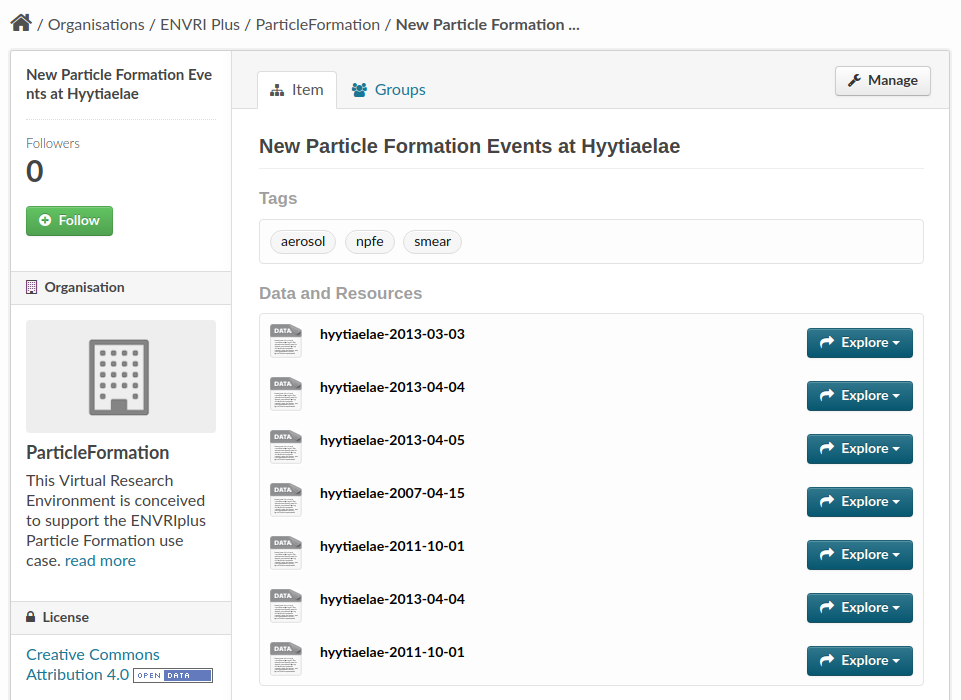
The catalog supports search of and access to derivative data. The following is example derivative data describing the event that occurred on April 4, 2013 at Hyytiälä, Finland. For the sake of (human) readability, we omit some details.
[] a lode:Event ;
  :hasClassification [
    rdfs:label "Class Ia"^^xsd:string ;
    rdfs:comment "Very clear and strong event"^^xsd:string
  ] ;
  lode:atPlace [
    a gn:Feature, dul:Place ;
    gn:countryCode "FI"^^xsd:string ;
    gn:locationMap <http://www.geonames.org/656888/hyytiaelae.html> ;
    gn:name "Hyytiälä"^^xsd:string ;
    wgs84:lat 6.184562e+01 ;
    wgs84:long 2.429077e+01
  ] ;
  lode:atTime [
    a time:Interval ;
    time:hasBeginning [
      a time:Instant ;
      time:inXSDDateTime "2013-04-04T11:00:00+03:00"^^xsd:dateTime
    ] ;
    time:hasEnd [
      a time:Instant ;
      time:inXSDDateTime "2013-04-04T12:00:00+03:00"^^xsd:dateTime
    ]
  ] ;
  lode:inSpace [
    a sf:Point, wgs84:SpatialThing ;
    geosparql:asWKT "POINT (24.29077 61.84562)"^^geosparql:wktLiteral
  ] .
In contrast to the corresponding data tuple collected in the notebook i.e.,
('2013-04-04', 'Hyytiälä', '11:00', '12:00', 'Class Ia')
the description also captures data semantics and does so in a machine-readable form.
Together with representatives of the scientific community, we are currently developing a concept for new particle formation event as part of the Environment Ontology. We will update the representation to follow the newly developed conceptualization once the concept is published.